Table of contents
Open Table of contents
What is the fuss all about?
I’m pretty sure that you have heard about useMemo before. A mythical hook that makes your app run fast. This article is a deep dive into how memoization works in React. Is useMemo really a silver bullet in terms of performance? What are the real costs of using it? And how can we use it to our advantage?

How does useMemo work really?
A quick refresher on the syntax and usage of the useMemo hook:
const memoizedValue = useMemo(() => computeExpensiveValue(a, b), [a, b]);We provide the hook with a factory function which is called the value needs to be recomputed. The second argument is a dependency array in which every expression is evaluated and compared to the previous render. If any of the dependencies change (react uses Object.is for comparison), the factory function is called again and the value is recomputed.
Results! and stuff…
Impact on compute
How do you even test it?
React uses its own scheduler which can be tapped into via the builtin <Profiler /> component. We will use it to measure the time it takes to render a component, two values come out of each profiling session, a baseDuration which measures how much compute time has the scheduler spent on rendering the component and duration which represents the actual duration of the task from start to finish. We will use baseDuration as our main metric, as duration is affected by the current internal state of the scheduler. The benchmark is made in such a way the values shouldn’t differ drastically, with a slight overhead on the side of duration.
The way we measure this is by performing some work in either the body of the component (control) or a useMemo callback, then we measure the time it takes to render the component. Then after a set amount of time we trigger an update and measure the time again. We repeat this process for a set amount of times and then calculate the mean and standard deviation of the results, in this case we are averaging over 20 samples.
We know the intended use of useMemo and its benefits, what exactly would happen however if we were to use it in a way that is not recommended? We will try to answer this question by measuring the performance of different scenarios unfavorable to useMemo:
The results are in milliseconds, displayed as
mean ± standard deviation.
One Hook Many Components
How long does it take to render
ncomponents, each of which uses a singleuseMemohook.
Mounting
| Components | Control | Memo |
|---|---|---|
| 10 | 0.13 ± 0.27 | 0.05 ± 0.13 |
| 1000 | 2.63 ± 3.16 | 2.41 ± 1.65 |
| 50000 | 91.04 ± 43.92 | 69.71 ± 48.49 |
| 100000 | 185.71 ± 237.64 | 115.96 ± 20.16 |
Updating
| Components | Control | Memo |
|---|---|---|
| 10 | 0.11 ± 0.12 | 0.03 ± 0.04 |
| 1000 | 0.82 ± 0.29 | 0.7 ± 0.35 |
| 50000 | 73.19 ± 66.05 | 101.92 ± 126.92 |
| 100000 | 88.38 ± 4.90 | 95.78 ± 11.78 |
Results indicate no significant difference between the two approaches, and even as we scale this absurd case to unreal numbers.
Note the high standard deviation in some cases, this is attributed to (possibly many) long GC pauses in the middle of the profiling session, causing one or several of the measurements to be much higher than the rest.
As we are profiling a very complex system, these spikes are not surprising and filtering them out might paint a wrong picture of the real world performance.
Many Hooks One Component
How long does it take to render a single component which uses
nuseMemohooks.
Mounting
| Hooks | Control | Memo |
|---|---|---|
| 10 | 0.07 ± 0.05 | 0.02 ± 0.04 |
| 1000 | 0.34 ± 0.12 | 0.51 ± 0.58 |
| 50000 | 51.57 ± 49.11 | 41.36 ± 26.53 |
| 100000 | 64.71 ± 6.48 | 117.61 ± 172.87 |
Updating
| Hooks | Control | Memo |
|---|---|---|
| 10 | 0.02 ± 0.04 | 0.01 ± 0.03 |
| 1000 | 0.50 ± 0.40 | 0.52 ± 0.47 |
| 50000 | 33.66 ± 16.56 | 26.91 ± 5.32 |
| 100000 | 54.84 ± 11.83 | 97.11 ± 168.17 |
Again, and surprisingly, no significant difference between the two approaches! As hooks are stored in a linked list next to a fiber-node, which are notoriously slow to traverse, I would expect the performance to degrade very fast as the number of hooks increases. That seems to not be the case and the added cost of GC is still much higher then the cost of running all these hooks.
Dependency Arrays
How long does it take to render a single component which uses a single
useMemohook withndependencies.
Mounting
| Dependencies | Control | Memo |
|---|---|---|
| 10 | 0.02 ± 0.04 | 0 ± 0.00 |
| 1000 | 0.04 ± 0.05 | 0.03 ± 0.05 |
| 50000 | 1.63 ± 0.06 | 1.68 ± 0.17 |
| 100000 | 3.38 ± 0.13 | 3.47 ± 0.11 |
Updating
| Dependencies | Control | Memo |
|---|---|---|
| 10 | 0.02 ± 0.04 | 0.01 ± 0.03 |
| 1000 | 0.06 ± 0.05 | 0.06 ± 0.06 |
| 50000 | 1.75 ± 0.10 | 1.76 ± 0.21 |
| 100000 | 3.55 ± 0.21 | 3.64 ± 0.14 |
Checking for equality of the dependencies doesn’t seem to have any significant impact on the performance of the component as reference checks are very cheap. We can see a slight increase in the time it takes to render the component as the number of dependencies increases, but the overall impact is still very small.
TLDR: React is very fast and the performance impact of
useMemois negligible across the board. Even in the most extreme cases, the difference is not significant enough to warrant any special attention. Managing memory correctly and not creating garbage is more important as GC spikes are much more impactful.
Memory impact
Memoization is a technique used to reduce the amount of work needed to compute a value. It does so by storing the result of the computation and returning it on subsequent calls. This is a tradeoff between memory and compute time, as we are now storing the result of the computation in memory, which is not free. The question is, how much impact does this have on the memory usage of our app?
Testing memory usage is a lot more tricky then testing how much time does something take, as the framework itself interferes with the results, you can easily run two instances of the same app and the JS heap usage can differ widely. Rather than exact numbers, we will focus on what happens under the hood and how does the browser handle it.
Having a rough idea of how GC works in Chrome (on which these observations will be preformed). A great resource on the topic is this video by SimonDev and the articles it references.
Base case
const Base: FC<{ n: number }> = ({ n }) => {
  getContent(n);

  return <div />;
};
Here we create a component that does some work, allocates a large array (2^20 numbers), and rerenders itself every n (via a trusty pulling a number out of my *** method we will choose 500) ms. Opening the browser profiler, manually forcing GC, capturing a record with memory sampling turned on, we can see the following behavior in Chrome:
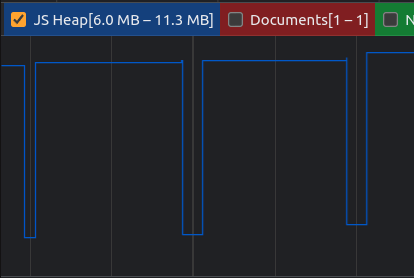
Memory gets allocated as the component is rendering, when the browser detects an idle state, it runs a minor GC and the memory is freed.
Memoized case
const Memo: FC<{ n: number }> = ({ n }) => {
useMemo(() => getContent(n), [n]);
return <div />;
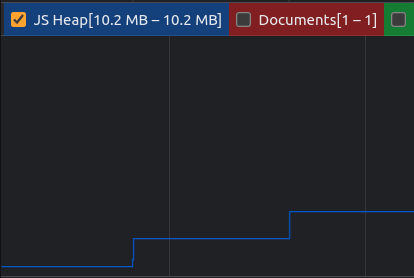
};We will now add a useMemo hook to the component, which will memoize the array. Using the same method as before, we can see the following behavior:
Is
useMemoleaking memory?
When we take a look at the bounds on the graph (top-left corner), we can see that barely any memory is being allocated at all!. As the dependencies of useMemo are not changing in this case, it is expected that no value is recomputed and no additional memory is used.
Recomputing
const Memo: FC<{ n: number }> = ({ n }) => {
// eslint-disable-next-line react-hooks/exhaustive-deps
useMemo(() => getContent(n), [Math.random()]);
return <div />;
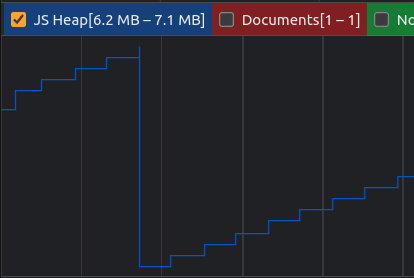
};Now lets force the value to be recomputed on every render by changing the dependency array to a random value. How will this affect the memory usage?
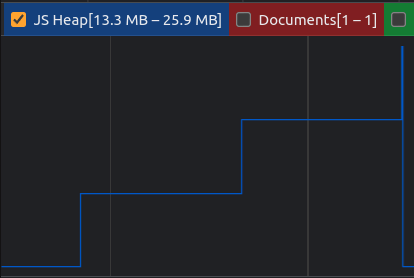
We can see that the memory usage is increasing as the component is rerendering, but it is not being freed as often as in the case of the base component.
The explanation of this behavior lies in how long we now have to hold on to each value. While in the previous case, we could discard it as soon as the component finished rendering, we now have to hold on to it until the next render, as it might be needed again. If the time we have to hold on to the value is long enough, minor GC will not be able to free it anymore. A major GC will need to be run in this case, which will happen as the browser runs into memory pressure.
useMemocan in reality only hold onto a single value - the current one. In case of a recomputation, the old value gets discarded, it is therefore not trading off space in the traditional sense, but by extending the lifetime of that value.
Keep in mind that in the base case we discarded the value as soon as we created it and didn’t have to hold on to it at all! If we were to for example render it, the value would not be unreachable as the
fiber nodewill still reference it! Doing this will preserve the value across renders just as in the memoized case, only the value will be discarded on each update.
Smaller allocations, more frequent recomputing
Our tests have so far been using the same parameters, what if we were to change them? We will now change the size of the array to 2^10 and the interval to 100 ms, so we avoid promoting the value to an older generation (thus making it unfreeable by minor GC).
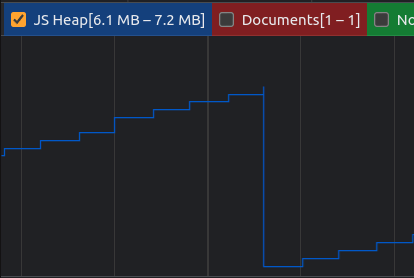
Which one uses memo and which one doesn’t?
When we alleviate memory pressure by allocating smaller values, GC isn’t triggered as often and the memory behavior is now indistinguishable from the base case (the latter one is the memoized case).
Conclusion
useMemo only stores a single value at a time, just as a variable would, and as such doesn’t require any additional space to function (in relation to the data it holds). Any additional space costs associated with useMemo are the closure it creates, and the dependency array which has to be stored for reference. Both of these costs are negligible most of the time, but still worth keeping in mind.
In the worst case, useMemo causes values to be referenced for longer, thus promoting them into older generations, and making their space harder to reclaim.
In the overwhelming majority of cases however, useMemo does in fact improve the memory footprint of your app by not creating garbage that will be discarded and thus reducing the amount of work the GC has to do.
Readability
A common argument against useMemo is that it makes the code harder to read. This is a valid concern, as the code is now more verbose, requires additional boilerplate and the reader has to sift through code that essentially does nothing in terms of semantics.
The react team is aware of this issue and has been working on a solution, formerly known as React Forget (unveiled during React Conf 2021, you can watch the talk here).
The rough idea is to introduce a compiler that will analyze the code and automatically memoize the values that are used in a way that is not detrimental to performance. This will allow us to write code in a way that focuses on the semantics of the problem, rather than the performance implications of the implementation.
Sadly, the official implementation is still nowhere to be found to this day 😢. A community effort however has sprung up and successfully made this a reality!
A sensible default then?
Knowing that useMemo has barely any downsides associated with it, shouldn’t we use it everywhere then?

Well yes! But it depends.
Are you building a mostly static site with not a lot of moving parts? Then you probably don’t need it (it might even be worth reconsidering react as your technology of choice). For the the rest of us who focus on building highly dynamic user experiences that utilize granular updates?
Absolutely, especially for larger apps!
useMemo driven development
useMemo enables granular updates when they are needed. React’s philosophy dumbs down to destroy the world and rebuild it from scratch on every render (destroy the subtree would be more accurate). It utilizes VDOM to make this process as lightweight as possible, but is still far from ideal, as it scales linearly with the number of nodes present in the subtree. We will take a look at how to squeeze the most performance out of React in an upcoming post!
Luckily for us, there is a way to opt out of this behavior, that being React.memo which acts as a floodgate for this process, essentially saying DO NOT UPDATE THIS COMPONENT AND ITS SUBTREE UNLESS ITS DEPENDENCIES (props) CHANGE. This works fine for primitive type props but breaks down a prop is being passed by reference.
const Component: FC<{ n?: number, options?: Options, onClick?: MouseEventHandler<HTMLDivElement> }> = (props) => {
  ...
};

const Memo = React.memo(Component);
const n = 1;
<Memo n={n} />; // Will not rerenderconst n = 1;
const options = { n };
<Memo options={options} />; // Will always rerender, memo has no effectconst handleClick = () => console.log(n);
<Memo onClick={handleClick} />; // Will always rerender, memo has no effectThe solution? useMemo!
const options = useMemo(() => ({ n }), [n]);const handleClick = useMemo(() => () => console.log(n), [n]);
// or
const handleClick = useCallback(() => console.log(n), [n]);
// useCallback is just a wrapper around useMemo, keep in mind the closure is still being created on every render (but as it is becomes unreachable as soon as it created, it will be GC'd almost immediately)The same thing applies to hooks with dependency arrays, by using useMemo we can ensure that the hook is only called when the dependencies change, rather than on every render.
const n = 1;
const options = { n };
const doStuff = options => console.log(options.n);

useEffect(() => {
  doStuff(options);
}, [options, doStuff]); // Will always run
When memoizing properly, we can ensure that references for objects stay the same if the object hasn’t changed and the react-hooks/exhaustive-deps will now become paramount as it will now infer the dependencies properly, even in case of referential types. No more hunting for unintended infinite loops and stale values!
How to spot optimize
A secret weapon that we now get for free, when all of our references are stable, is the superpower of spot optimization! We can now use React.memo on expensive components fearlessly, the equality checks for props will now always work as intended and we can be sure that the component will only rerender when it needs to.
This takes a major burden off of our shoulders and allows us to focus on the problem at hand instead of worrying about the guesswork involved in when do objects change their references (why-did-you-render is a great tool which helps in diagnosing these issues, that you should definitely consider using!). All that without hacking away at the arePropsEqual parameter of React.memo!
A common approach to spot optimization is to first wrap an component in
React.memoand then try to track down and memoize component’s dependencies one by one. For each dependency, we then have to recursively do the same thing over and over again, until we memoize the entire dependency tree.
For larger apps this is simply never an option and even when done correctly, when new dependencies are introduced, the entire process has to be repeated again. This leads to a lot of performance regressions which are notoriously hard to track down effectively.
A much better idea is to set up your project in such a way that these dependency trees are already stabilized and always ready to be memoized. You can also go the extra mile to add React.memo to most of your components by default, making even top level updates extremely performant at the cost of a bit of boilerplate.
Conclusion
Don’t be afraid to use useMemo! It is a great tool that can help you squeeze the most performance out of your app and make it more resilient to performance regressions. Your app will be faster (especially in terms of granular updates!) and more reliable as a result!
Looking for a way to make your app even faster, blazingly fast some might say 🔥? Check out SolidJS! A framework that takes the best parts of React (JSX) and rethinks the rest from the ground up. No VDOM, no reconciliation, no useMemo! Just pure performance and unparalleled developer experience!
All the code used in this article can be found here